DYNAPORTE TOOL DETAILS

OTHER LINKS

Copyright 2007 Burlington Hall Asset Management, Inc. All rights reserved.

Contact Us
Downloads
Support
Pricing
Theory
Software
Home Page
Data
Regression
Optimization
Simulation
Tools

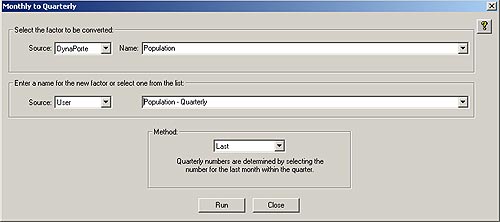
The Convert tool converts monthly data to quarterly data in order to mix data provided in different frequencies.

Tools Screen Shot #1
The Report Generator provides customized reports on multiple factors and investments using user selected descriptive data fields. The resulting report automatically includes the historical data and a report of 18 statistics for the user specified date range.
Tools Screen Shot #2
The Calculate tool allows you to create a new time series from combinations of existing factors. Standard mathematical operators are allowed in addition to specifying time lags.
Tools Screen Shot #3
Tools Screen Shot #4

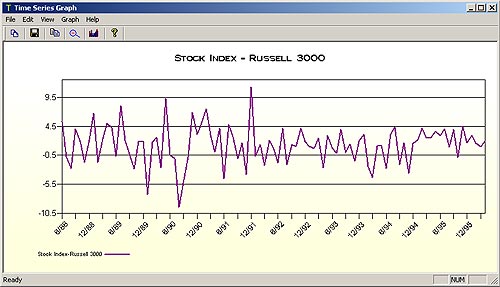
The Time Graph Generator provides a quick view of how the factor changed throughout history. This may be printed or saved as a JPG or a GIF file.

Request a Brochure