|
|
|
|
|
|
|
DYNAMIC OPTIMIZER DETAILS
|
|
|
|
The Allocation table displays the actual allocation to each investment for each month during the selected time series. Portfolio Return and several statistics are also calculated. |
|
|
|
The Freqency Distribution chart displays the breakdown of the monthly Portfolio returns. |
|
|
|
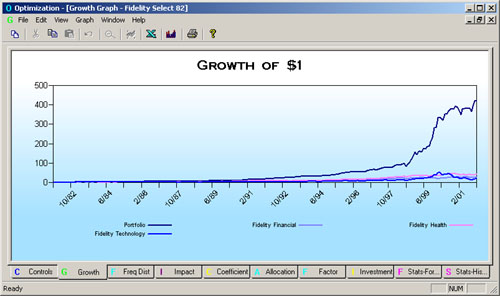
The Growth graph displays the growth of $1.00 for the Portfolio, as well as the individual investments over the selected time period. |
|
|
|
|
|
|
|
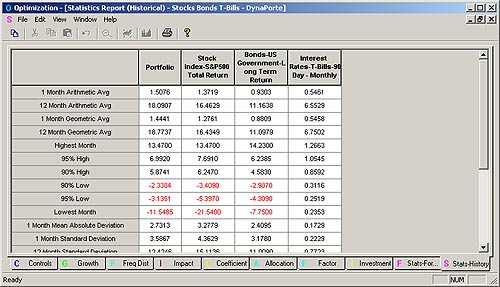
Several other tables complete the Optimization Results. |
|
|
|
OTHER LINKS
Copyright 2007 Burlington Hall Asset Management, Inc. All rights reserved.
|
|
|
|
|
|
|
|
|
|
|
|
|
|
|
|
|
|
|
|
|
|
|
|