|
STEPWISE REGRESSION DETAILS
|
||||||||||||||||||
|
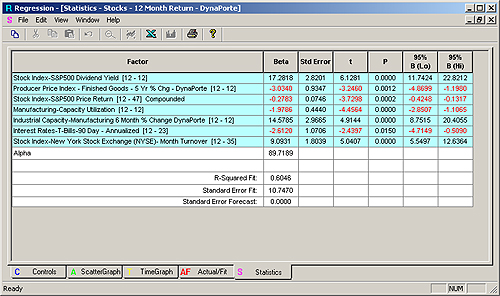
The Statistics tab displays various statistics on each factor employed by the regression. Factors are highlighted in blue when they have a significant impact on the selected investment. This table may be exported to Microsoft Excel with a single click. |
||||||||||||||||||
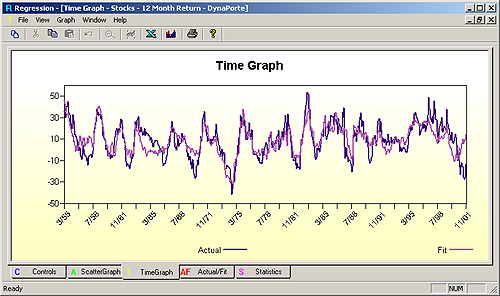
| The time graph displays Actual and Fit versus time. | ||||||||||||||||||
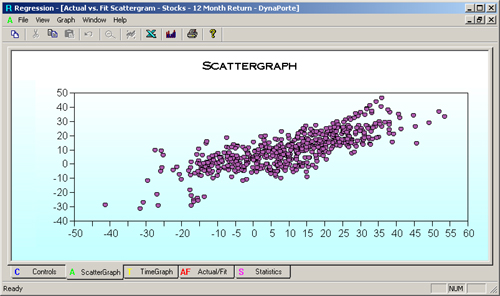
| The Scattergraph displays the actual versus fit values of the investment returns for each month of history. | ||||||||||||||||||
|
||||||||||||||||||